What this year taught us about solar
No coal for Christmas. Solar took the lead!
2025 wasn’t a smooth ride for the renewable energy industry. The rooftop market slowed, and many teams had to work harder for the same results.
At the same time, solar became Europe’s leading source of electricity. A contradiction, maybe. But also a reminder of why the work continues. It shows us steady progress, and we see (and hear from our community) that people and systems are adapting to new trends and regulations.

New Records
At least 13 EU countries hit new records for solar generation in June 2025
Industry trends
Key numbers in solar this year
This 2025, Eturnity supported the creation of the PV Barometer report with real, insider data from the solar industry. Find the full report here, or read up on quick facts below.
30%
22%
20%

30%
22%
20%
65 GW
>40%
65 GW
>40%
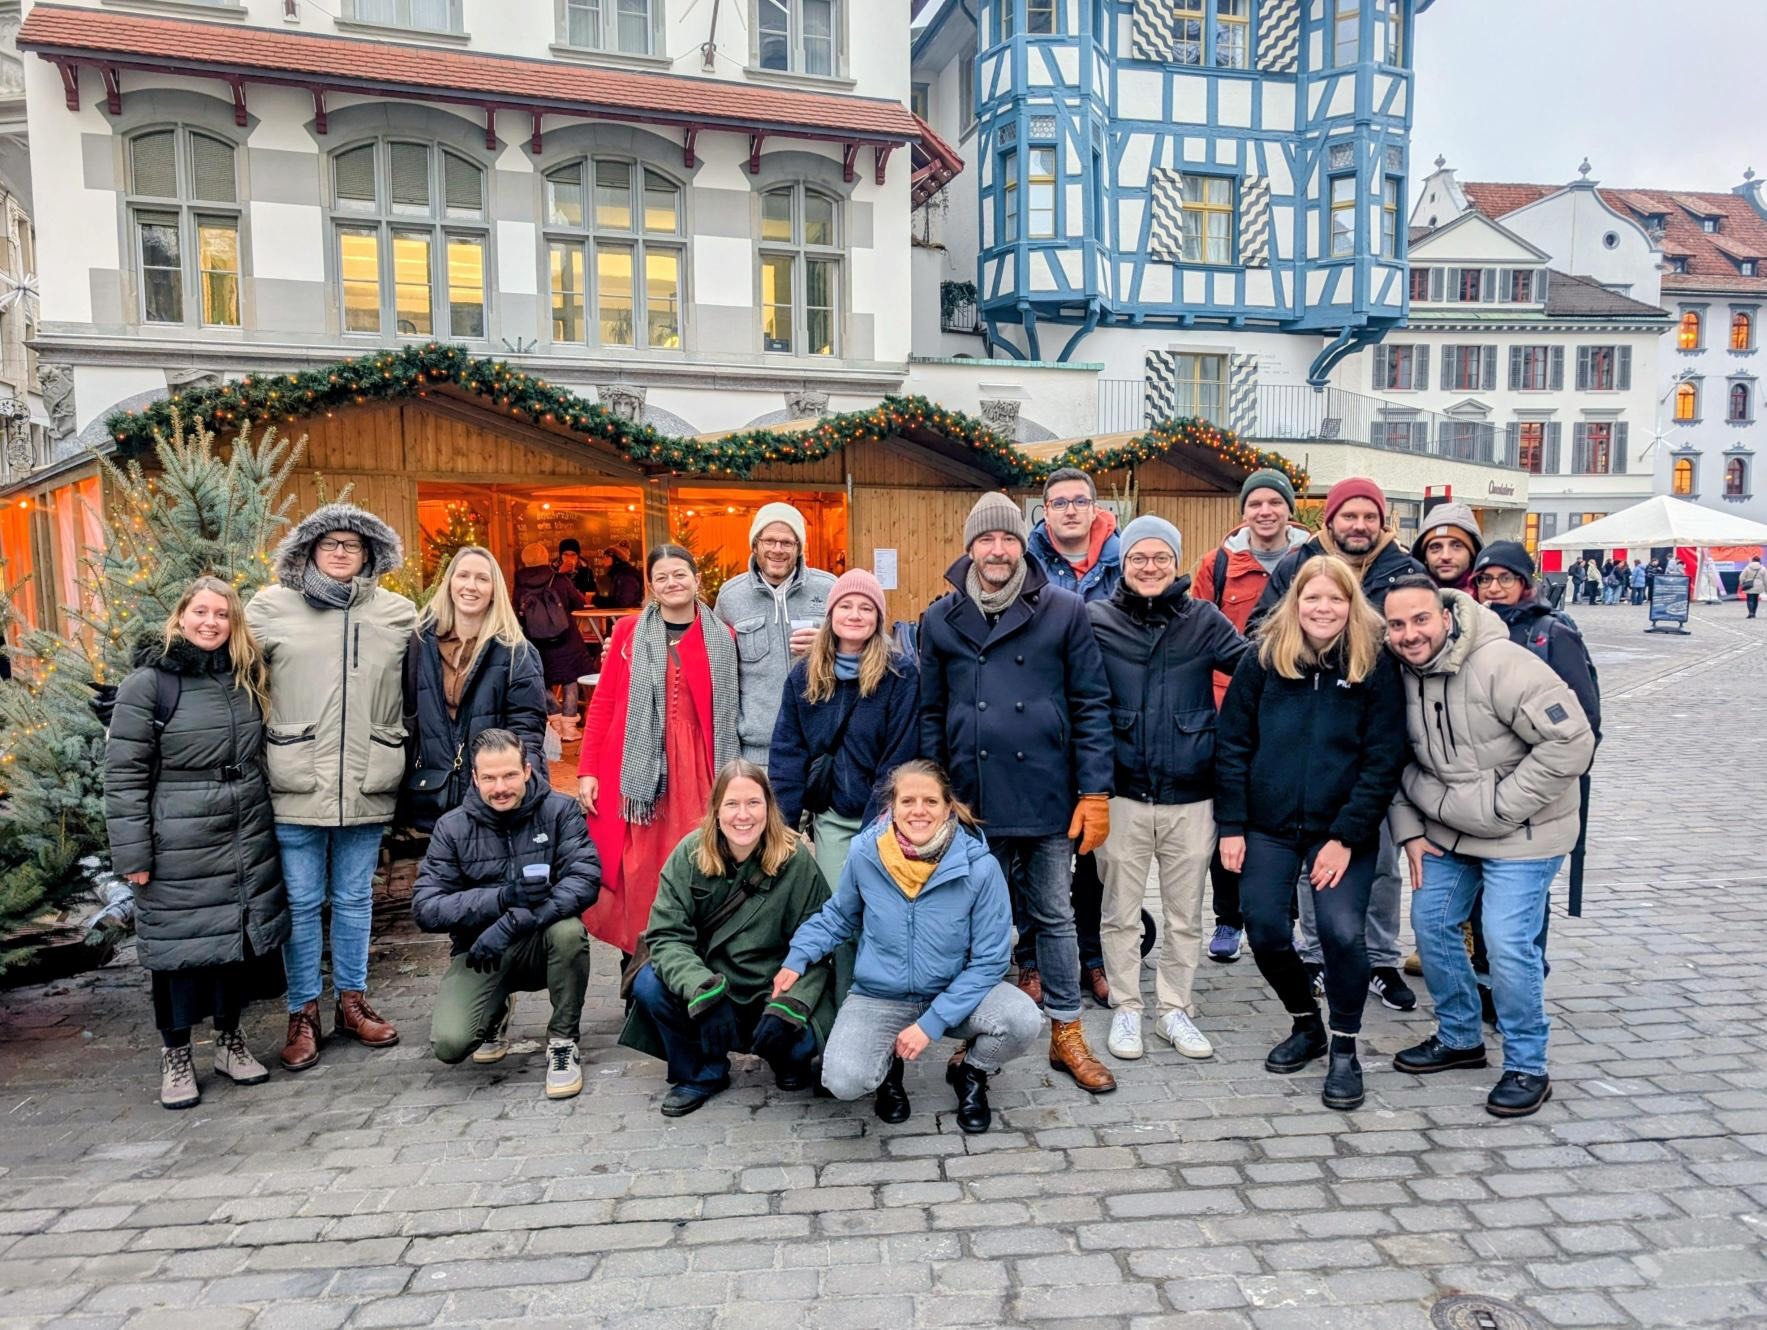
Most of those 35,000 km were travelled by local teams, in their own regions. To go to trade shows, host events, and actually meet people in person.
We now have teams on the ground in 7 countries, speaking the local language and dealing with local rules and realities every day. That keeps feedback honest and practical, and it helps us build tools that can meet the demand and regulations of installers across Europe.

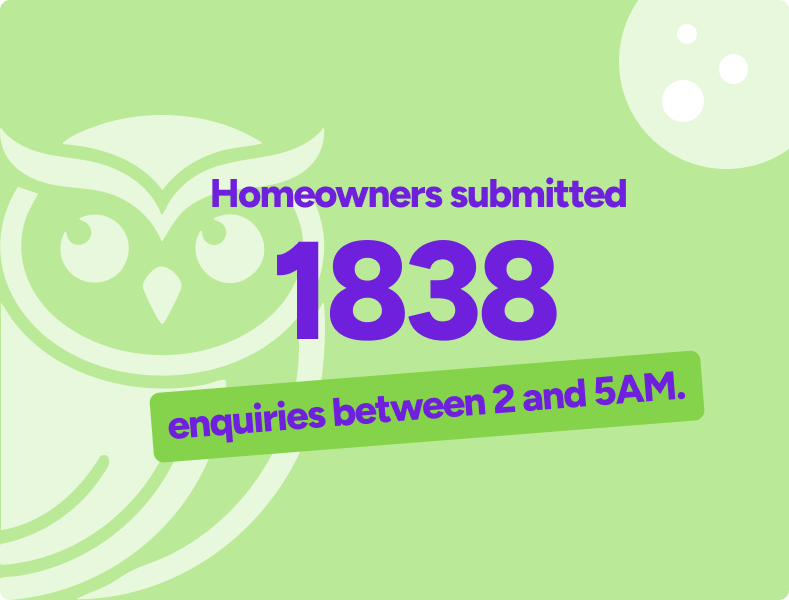
Not everyone thinks about solar during office hours. This year, 1,838 homeowner enquiries came in between 2 and 5 AM through our Solar Calculator. Clearly a few night owls, doing their research when the house is quiet.
Our 2025 data shows that 51% of enquiries came in after hours. That sets the tone. To answer their questions when they come up, we can’t wait till the next morning. The Solar Calculator handles the first step instantly, giving homeowners an estimate tailored to your business. And you the first round of necessary information, so leads are qualified by the time you’re back at your desk.
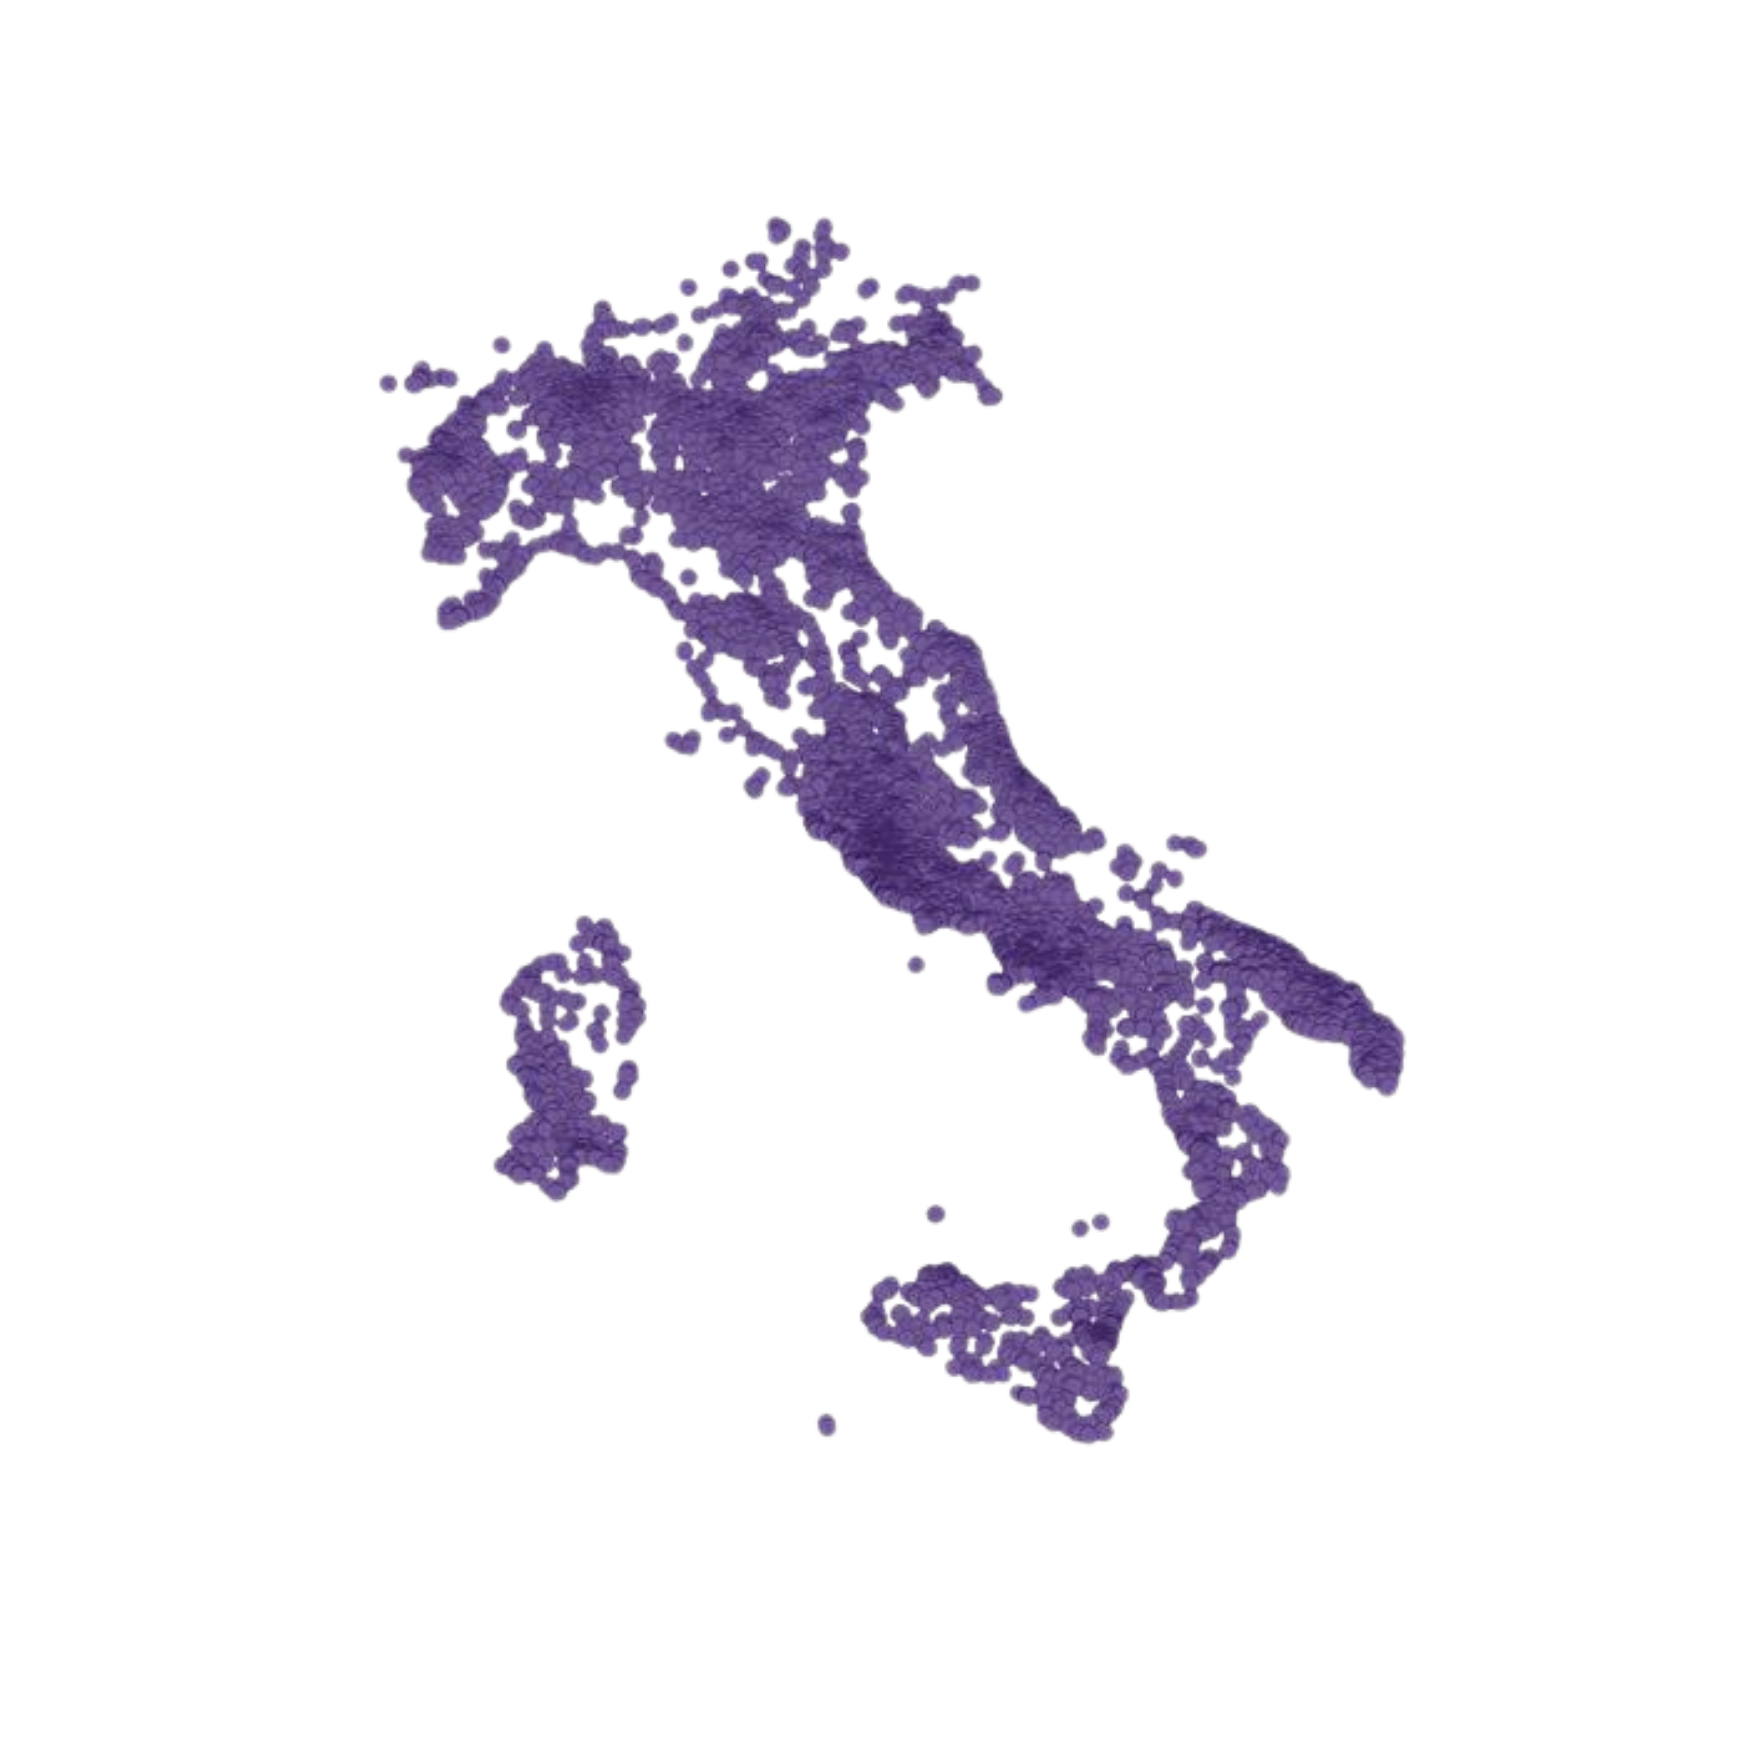
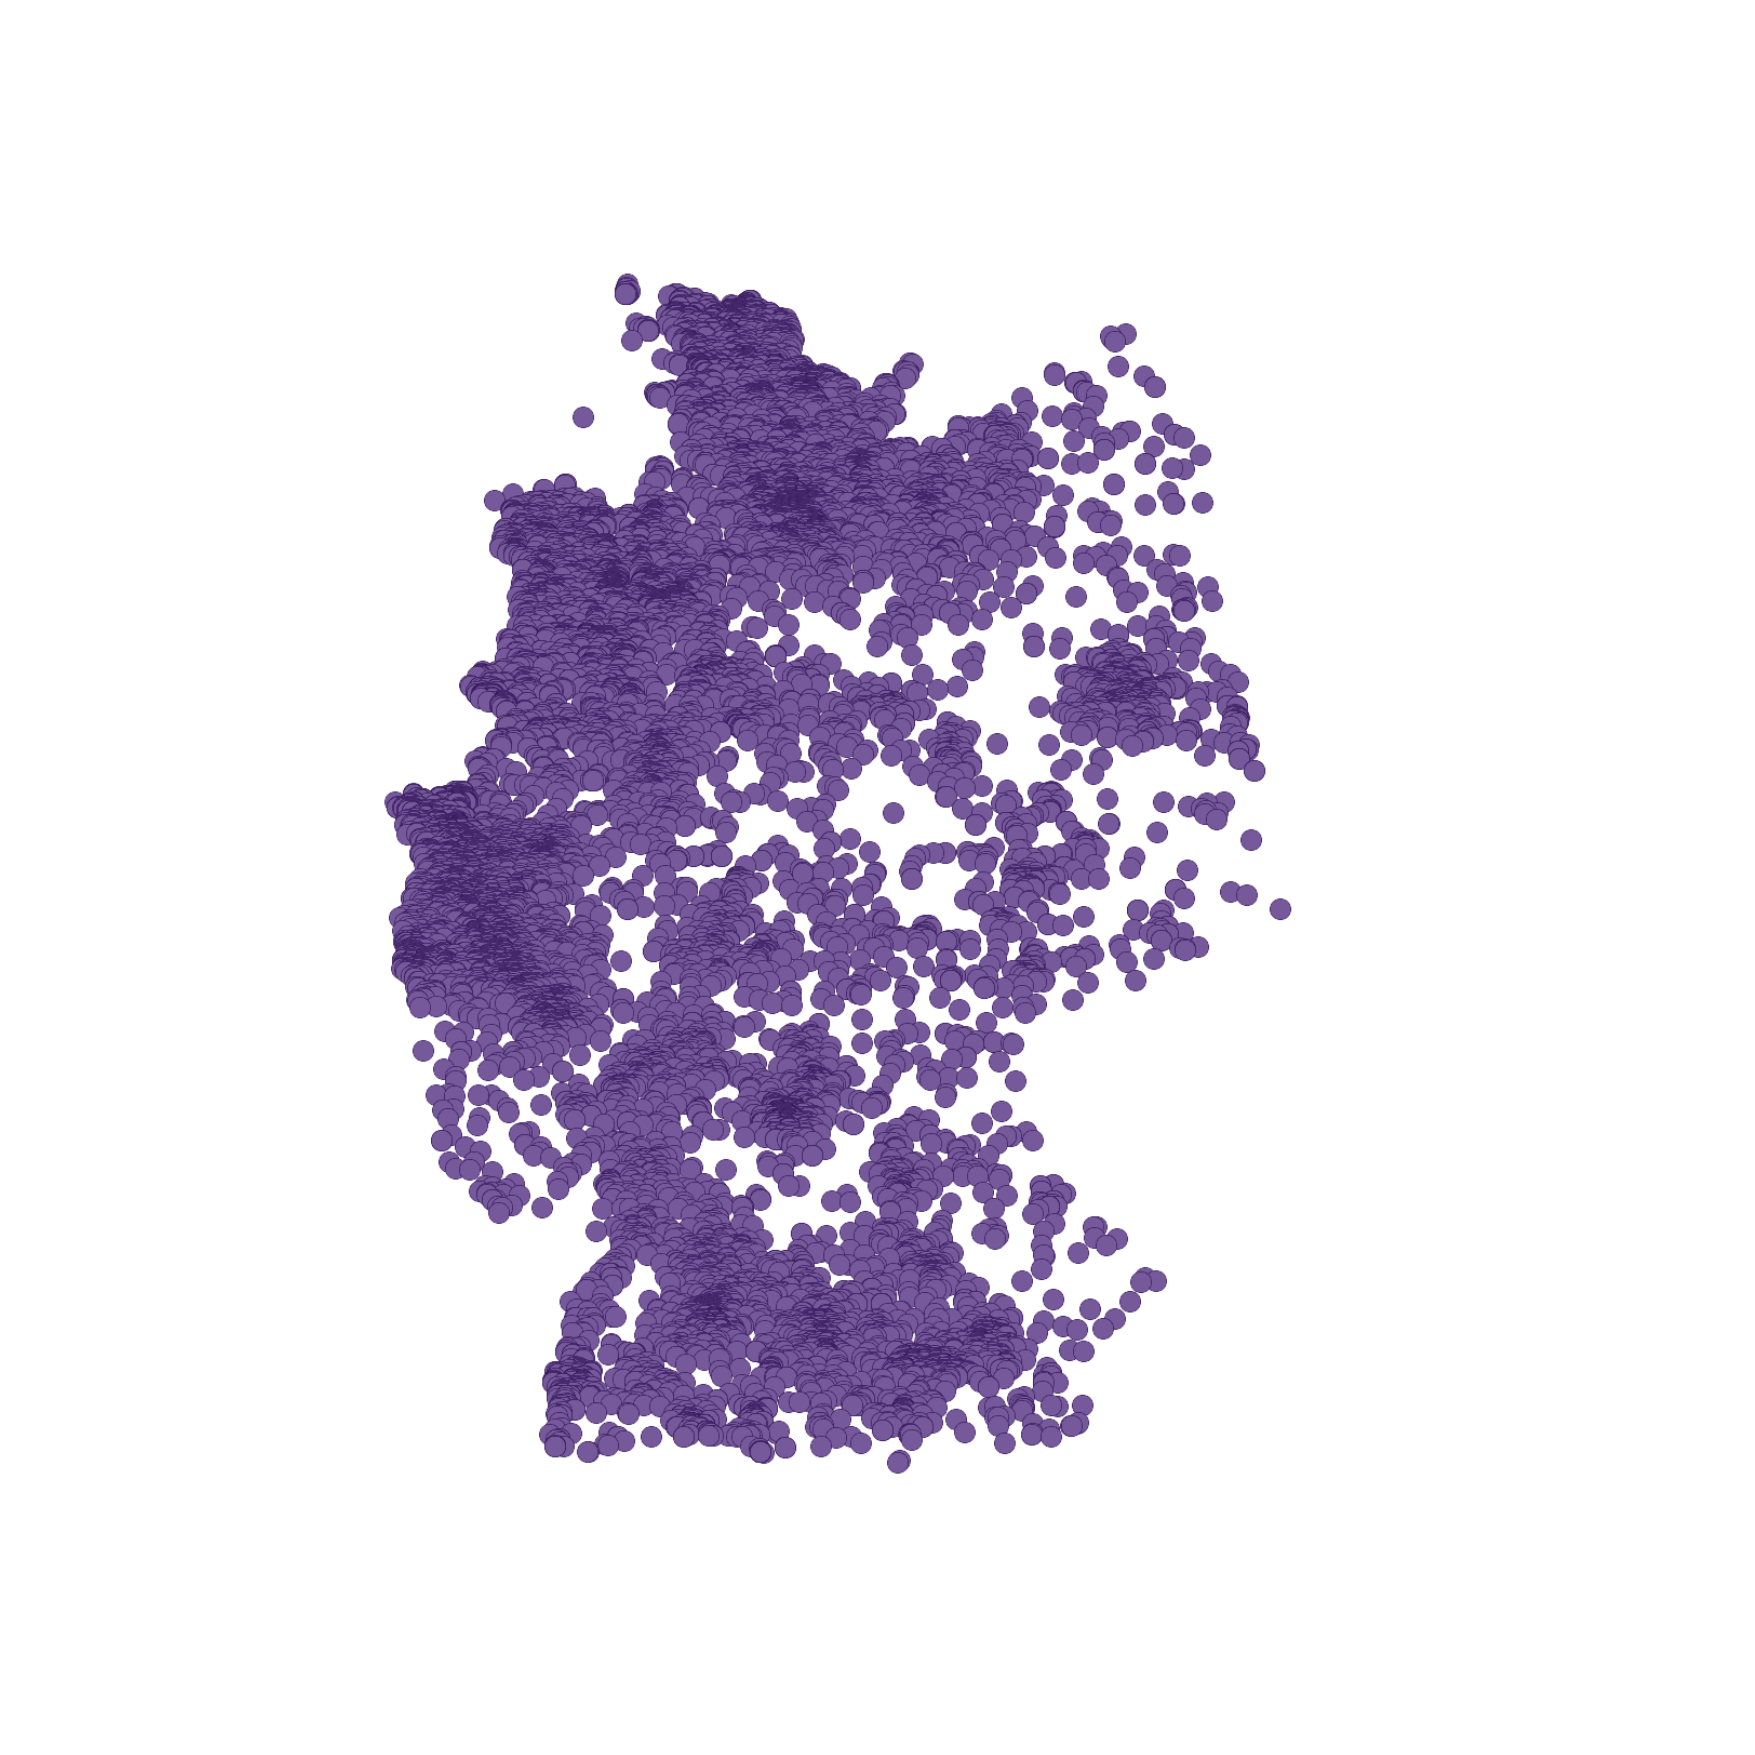
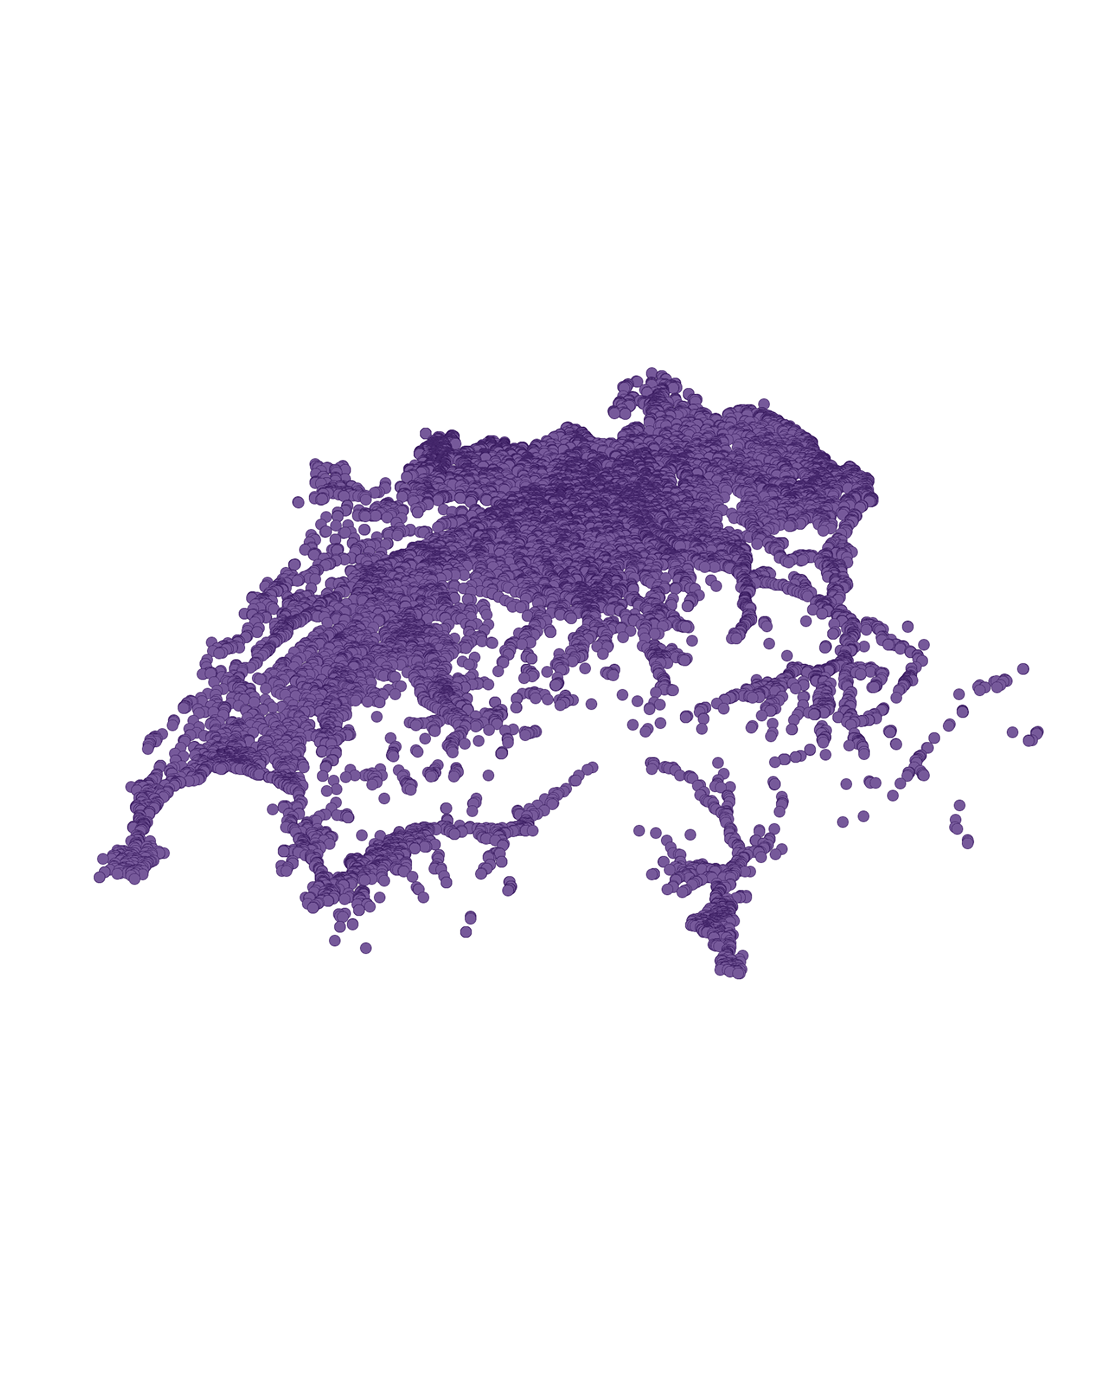
A dot for every PV project planned by our community
Some of the new features 2025 brought you
- 01Single Line DiagramsThis tool allows you to automatically generate professional-grade SLDs, delivering a clean and accurate representation of your renewable energy system - including modules, string configurations, inverters, combiners, breakers, meters, chargers, and heat pumps.
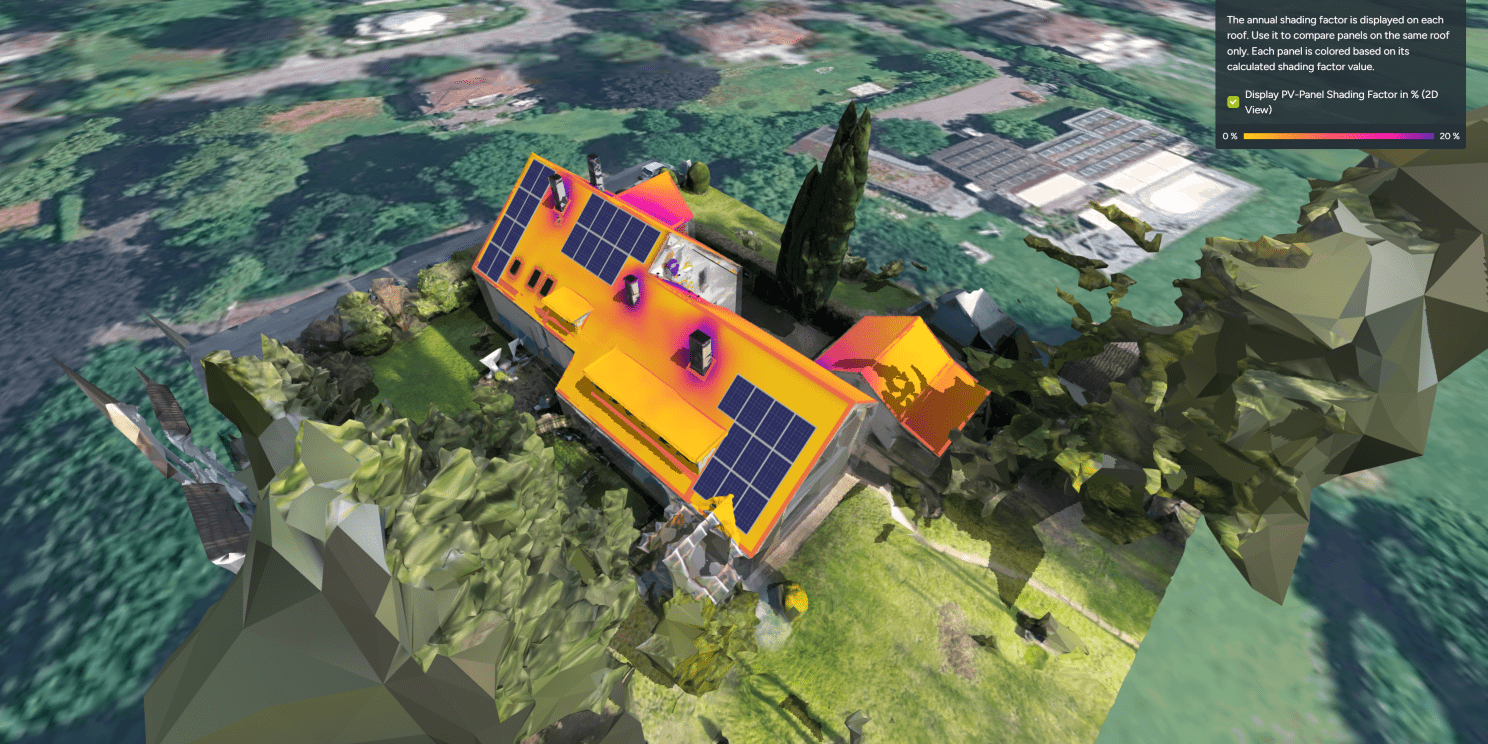
- 02Shading AnalysisOptimise every panel placement with real shading data right from the 3D panel view.
- 03String and Inverter DesignAutomatic inverter configuration, with suggestions for suitable inverters, calculation of configuration proposals, and the automatic creation of optimised, editable string layouts
- 04Kanban ViewA new, organised, and fully customisable overview of all your projects across their different stages.
- 05New Mounting system integrationsWe integrates directly with several mounting system providers so that when you plan a project, the Bill of Materials (BOM) for the mounting system can be generated automatically. Including ENSTALL, K2, Van der Valk, Clenergy and more